Digital graphics used in eLearning come in various image types and present different types of information. In the Series 1 of this article, we learnt how communication functionality is important to usage of graphics in eLearning. Digital graphics can be stand-alone, self-explanatory, and usable as a learning object, with different informational value. They can be integrated into a broader story to complete the scope and story. Digital images may be stand-alone visuals, or they may be a series of integrated multimedia and text. They may be real video captures, illustrations in e-books, animated digital avatars or simulations. Different image types offer different types and level of information. They help clarify complex information and relationships with the context in entirety.
Graphic images chosen for an eLearning engagement need to be copyright free and relevant to the content. Incorporating graphics helps the learners to relate to the content and enhances the overall professionalism. Let’s look at different ways in which graphics can be used in an eLearning course.
Key Concepts/ Ideas/ Conceptual

When learners are familiar with the items in a photograph or illustration, used to represent ideas or concepts, it motivates and helps them learn by correlating the present information with past experiences.
Story telling / Scenarios

While using Articulate storyline for narratives /stories, still photos help add depth and ensure the audience gets the message. Using too many images clutters storyboards and the flow of information is lost among the images.
Diagrams and Graphs

Diagrams and graphs help learners understand abstract concepts using corresponding visuals. For example, bar graphs and line graphs help learners understand trends, compare data etc.
Labelled Parts

Labelled illustrations help learners understand specific parts /components of a product or equipment. Labelled illustrations can significantly optimize cognitive load on the learner by maintaining focus on key areas.
Motion and Paths

Graphic visuals are a potent way to show the movement of one or more entities. For example, an aircraft’s path with connecting lines over that particular geography.
Geography and Statistical Data

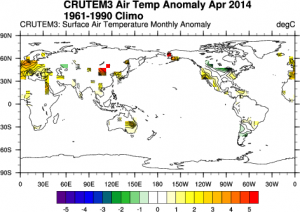
Maps are ideal for helping learners understand location and geography. Statistical maps representing variations in quantity of a particular factor, such as population, cell phone usage etc. help learners quickly perceive and understand map information because it is a commonly used visual format.
Metaphor

Instructional designers like to use metaphors to explain something unfamiliar by comparing it with a familiar object or idea. For example, an idea is often represented with the image of a light bulb.
In the next series of this article, we will share about taxonomy of communication, visual grammar and more.
Keep watching this space for more!


